| |||
|
Saturday, April 14, 2018


Thursday, January 18, 2018
Happy New Year! Piedmont RE Update--
Happy New Year!
We're through the holidays and looking forward to the coming year--and all its changes and opportunities! Where might a home purchase or sale fit among your New Year's resolutions? I'm already slotting buyers and sellers into the calendar, so be sure to reach out to get the process rolling. And remember, my job and passion is to help you make great real estate decisions; I get paid when you or someone you know buys or sells relying on my expertise.

Last year was really quite strong for me, with over $15 million in real estate bought and sold, including five over-$1.9 million sales. With the tax law now changed and demographic and economic forces uncertain, you especially need to rely on a deeply experienced licensed broker focused on your local market. And know that if you want assistance in a different state, different region, or over a bridge or through the tunnel, any broker working with your interests paramount will refer you to an agent or broker who focuses on that local market. We all should know what we don't know, and not be distracted by the possibility of making a buck at our clients' expense.
You'll find below an end-of-year recap on Piedmont, the East Bay, Bay Area, CA and national real estate trends, an update on the final final tax changes and what they might mean for you ( :( ), some analysis of the sell vs. renovate choice, and some other cats and dogs. By the way, did you know that 40% of homebuyers in CA drive their home-buying choices with pets in mind?
The Big Picture
I've been poring through various analyses of 2017, plus forecasts for 2018, including Pacific Union's Northern California analysis and forecast in collaboration with John Burns Real Estate Consulting (see the one-hour video here), Southern California forecast (see that video here), the Urban Land Institute's Fall 2017 forecast for commercial as well as residential real estate (here), and the excellent analysis and forecast of the Ca Association of Realtors (CAR) (you'll have to email me for a copy of the Powerpoint deck). If you just want the tasty bits, read on.
All the experts seem to think that the economy and job growth will be slowly cruising along through the coming couple of years. To the extent that real estate has derived demand, that's a good thing: It appears you'll have someone with a job and resources to sell your home to. The expectation is that interest rates will rise about 20 to 25% (from 3.x to 4.x) between now and 2020. That is, they will remain very low by historic standards, but note that when interest rates go up 20%, payments go up about 20%. And 20% more of a big number is a big number (even if incomes are expected to increase by 3% nationally and 4.3% in California in the coming year). So we'll be watching to see if rate hikes lead to some softening in the market. Unemployment will remain low (it was 4.2% nationally, 5.4% across CA, and 4.4% in Oakland/3.3% in SF at the time of the CAR report). Bay Area tech jobs have been not only growing at a slower rate, but actually declining slightly in overall numbers.
Similarly, and I'll go into it in greater detail below, the new tax law is expected to make owner-occupied residential real estate investment less attractive, at the margin, in high-income/high-cost states like California. At a minimum, I expect a bit of a "I hear that housing should drop in price--can I offer less?" effect through the market until buyers realize that even if we go from six offers to four offers on a great house, they'll still need to put their best foot forward to actually get the house (which is the goal, no?).
Both John Burns and Ken Rosen (formerly at Berkeley and heading the ULI panel) see a low and slow progression of the economy with regard to job growth, unemployment, and inflation, and both pointed out that just because this very low-key recovery is about to claim the title of longest expansion ever, there's no indication of an impending recession. Remember, recessions aren't typically at all like the last recession. Housing finance has been very carefully monitored, so neither expects the crunch to originate with real estate. Burns anticipates a tech-driven "hiccup" by 2020; both argue that tech is way overpriced, and obviously the Bay Area would be ground zero as any job-related impacts "infect" the regional real estate market.
Ken was concerned about the potential for inflation and an overheated economy as a result of tax cuts paid for through government borrowing. The ULI team focused on immigration policy as a significant potential threat--much of our economic activity and real estate activity today comes from legal immigrants--John Burns said 25-30% of LA area homebuyers are foreign-born. If that were to be cut by half as planned (and ignoring the effects of policy change on illegal immigration), the impact on the economy and real estate would be noticeable. [There was a year among the last few where every one of my clients had at least one partner who was born elsewhere.]
Speaking of demographics, the ULI analysis pointed out that homeownership rates are down 10-12% for Millennials compared to their parents at that same age. The CAR explains these new attitudes about homeownership by pointing to lack of affordability (the percentage of buyers able to qualify for a median-priced home is now 29% across the state and only 17% in Alameda County), student debt, skewed income distribution, Boomers who won't move (because of Prop 13, capital gains taxes, low low mortgage rates, and lack of retirement savings), tax reform and institutional investors buying up formerly owner-occupied single-family homes and renting them out. By the way, 37% of CA Realtors thought the market was just "too hot."
How hot is it? The CAR anticipates a 1% increase in the number of sales next year, along with a 4.2% increase in median price. Clearly, there will still be too much demand chasing too few offerings. The Housing Affordability Index, already super-low at 29%, will drop to 26%. If the tax bill leads to any marginal price drops, the Association anticipates that a number of sellers will just hold their homes off the market for a while, exacerbating the problem. Looking at the past year, the CAR reports that 50% of all CA real estate transactions went over the asking price (suggesting multiple offers) and that was the case with 77% of Bay Area transactions. The typical offering in the Bay Area went into contract in 10 days--the average across the state was an unheard of 13 days.

The Market
OK, OK. So what about Piedmont?? Last year saw 125 homes trade (as reported by the MLS) compared to only 97 in 2016. The average price was actually down 3.5% ($2.19M down from $2.27M the previous year), while the median price was down just a tad at 1%. Recall that last year this time, the differences between 2015 and 2016 were so inconsequential that I essentially dropped the details and said things were just "flat." The most expensive home closed at $5.25M (down from $6.2M in 2016) while the least expensive home traded $850K (down from $880K).
The velocity of the market was rather consistent: Homes closed in an average 14 days on the market, received 3-4 offers (if the number were reported) between the two years. This translated into a price per square foot of $820/sf in 2017 ($790/sf in '16 due to the slightly larger homes that sold that year).
Turning to surrounding neighborhoods, the story remains rather different, as was the case last year. Looking at single-family homes in the surrounding zip codes of Oakland (94610,11, and 18), 536 homes sold for an average $1.36M/median $1.3M in an average 21 days/median 14 days. The most expensive home closed at $3.03 million, and the least at $450,000. These data represent a price increase of approximately 9% over last year, though a drop of about 9% in number of homes sold.
Likewise, Berkeley saw 525 single-family homes close in 2017 (510 in 2016), leading to an average sale price of $1.306M ($1.211M in '16) and median sale price of $1.21M ($1.105M in the previous year). Thus, the average price went up 7.8% in Berkeley, and 9.5% on a median basis in 2017 over 2016.
The pattern holds at the state and regional levels: Prices across the state were up 8.8% Nov. '16-Nov '17 (the last month for which data are available), condos statewide were up 8.2%, the Bay Area broadly was up 12.5% and Alameda County was up 10%. In all cases, the number of homes sold was up or down less than one percent year over year.

So what's happening? Why are Piedmont's prices stuck in neutral while the surrounding areas continue their upward climb? A couple of possibilities:
--the "smart money" buying in Piedmont can see into the future and anticipates a slow down. We did see the Piedmont market flatten a full two years before the rest of the area in late 2005.
--preferences of buyers might have shifted. Are higher end buyers more comfortable in Berkeley or nearby areas of Oakland than in less transit- and latte-friendly Piedmont? I've talked in these pages about my perception that buyers rushing into Berkeley (and then into Crocker Highlands and Piedmont Ave. in the last two years) were not interested in Piedmont.
--have significant improvements in public schools in Oakland and Berkeley paid off for those neighborhoods, relative to Piedmont?
--are our regional move-up buyers locked into their current homes by rock-bottom mortgage rates or lack of needed downpayments, after accounting for capital gains taxes due and other debt?
Whatever the reason, know that a calm and flatter market is one that typically has more staying power. During the Crisis, it was the neighborhoods with super-rapid price increases, lower prices, lower downpayments, and owners with less capacity to roll with the economic punches that were hardest hit.
Given that the experts are anticipating more modest home price increases statewide in 2018, we may just be early to the party (which is certainly better than late to the party.....).
Cost vs. Value Report
It's time for an update of that handy analysis that looks at how much various improvements cost, compared to how much their construction adds to the value of the home at sale. As always, the report looks at a number of renovation projects across the nation, within the Pacific region, and in the SF Bay Area.

And as usual, the returns on investment in the Bay Area are significantly higher than for the same project done elsewhere in the country or in the Pacific region. In fact the payback rates are dramatically higher than they have been since the Crisis. My argument is that higher prices in combination with Prop 13-protected property tax levels lead more owners to reinvest in their properties rather than move to get what they want. Email me if you want me to email a copy to you--there's quite a rigamarole to get the doc at the website.
How 'bout that Tax Bill?
As I noted in a Facebook post a while ago, the tax changes seemed to have taken aim directly at communities like those of ours in the East Bay. While a few elements were dropped (so you still need to live in your house for 2 of 5 years to be exempt from some capital gains taxes, rather than the proposed 5 out of 8 years), many survive. Let's see how the key elements play out for a typical $1.2 million home, and then a $2 million home. Assume in both cases that the owner has an income of $200,000/year, and is taking out a $1 million mortgage when they purchased yesterday.
The $1.2 million homeowner would deduct about $15,600 in property taxes (1% Prop 13 taxes plus a number of other taxes), $40,000 in mortgage interest and $13,600 in state and local income taxes under last year's law. S/he also can deduct the personal exemption for say 4 family members, or $18,000. In total, these deductions represent $87,200 in deductions from that income.
Under the new law, the household would still benefit from itemizing deductions, compared to the doubled standard deduction. But new limits on the deductions are significant and "bite": The $29,200 in property and state and local taxes could be deducted only up to $10,000, while the limit on mortgage interest results in a $30,000 deduction there. The personal exemptions disappear, so rather than deducting $87,200 from income, this household deducts only $40,000. Assuming a rough 30% marginal tax rate, homeownership of that home will now result in savings of $1000/mo rather than about $2100/mo (before state taxes).
The $2 million homeowner would deduct about $26,000 in property taxes, the same $40,000 in mortgage interest (given that "old" law already allow deductions of interest on up to $1 million in mortgage debt), let's say $10,000 in state and local income taxes and $18,000 in personal exemptions, or $94,000 in deductions. Under the new law, the household is limited to the same $40,000 in deductions. So, at 30% marginal tax rate, $1,000 per month savings due to homeownership rather than about $2600/month.

Three things to focus on here:
--The state and local property and income tax limits and the interest deduction maximum will never "bite" owners of cheaper homes--i.e. a condo in Oakland or a large home in rural Ohio. So they can itemize as much as they want or perhaps more likely, just take the doubled standard deduction. It's only the homes in high-cost and high-paycheck areas that get bitten. That's one argument to make a move to a less expensive area now---
--Lenders don't consider these tax savings as they underwrite a loan. A buyer may (or may not) think ahead to those savings in figuring the home price they are comfortable with, but my experience is that buyers typically just let the banker tell them how much they can afford. In fact, buyers rarely think about monthly utility savings from double-paned windows or high-efficiency systems, or one-time transfer taxes and annual parcel taxes--unless I mention it. (Lenders do factor in these latter charges as they underwrite.) So I'm unclear whether these changes will affect buyer behavior on the ground in our high-demand markets.
--These effects may likely be matched or over-shadowed by the effects of higher interest rates (for new homes), if the expected modest rate rise takes place.
We'll see how these changes unfold, if states (or localities) come up with strategies to dampen their impacts, and if buyers change behavior. Note also that the mortgage deduction applies to $1 million in borrowing whether for a primary residence or a vacation home, that interest on your current home (up to $1 million, not the new $750,000 cap) is grandfathered in until you sell the house--even if you refinance as the NAR understands it, and that interest on home equity lines is no longer deductible.
Don't Forget about Scrip!
If you're thinking about that cost vs. value tradeoff, don't forget to consider paying in scrip! X% of a big number is a big number. Home Depot pays 4% of your purchase to Piedmont schools, Amazon pays 3%, and Pottery Barn/Williams Sonoma pays a hefty 8%. It adds up! Check out the program here, and while you're at it, sign up for monthly or one-time deliveries again.
On the Job with Energy Efficiency
I've just joined PGE's Energy Hub advisory team, exploring energy efficiency opportunities in the built environment. I'll pass on insights and useful tidbits as they emerge. And Pacific Union now has a joint venture with Nest thermostats--reach out if you want a great price for a new thermostat, and how-to instructions on the $50 rebate from PGE. Installing the thermostat locks in major energy savings for the life of your thermostat, and I can't tell you how many 1955 thermostats I see out on broker tour in our older homes! Don't forget, I'm one of the few deeply trained EcoBrokers in the area, and am a longtime co-sponsor of Build It Green.
Lots of insights anticipated for the April Fool's Day update!
The State of the Real Estate Business in Piedmont
Every year or two I review sales the previous year. I'm always amazed by how diverse the group of agents and brokers is who successfully help buyers and sellers move to the next stage of their lives!
For instance, 2017 saw 125 transactions close in Piedmont, as documented by the MLS. They totaled $273.5 million, a 24% increase over the previous year (good for City transfer tax revenue!). That means 250 "sides" were involved, typically with one agent on each side.
In five cases, the same agent managed both sides (and was ethically prohibited from advocating or working aggressively for either side--not a great place to be for typical buyers and sellers. I make it a policy to never represent both sides of a transaction).
Among these 125 transactions, 38 different brokerage firms were involved, and 112 different agents (by my best count--careful eyeballing). They are large and small firms, local and from further afield--through the tunnel, in Marin or the South Bay or sometimes San Francisco. Firms and agents you've heard of and those I have not.
In most cases, the buyer and seller were represented by different firms. In about 1/3 of the cases, the buyers and sellers were represented by the same firm (even if it's a Pacific Union office in Danville and mine in Montclair), but not the same agent.
And in case you're wondering, 13 of the sales involved a 3% fee to the buyer's brokerage (typically the same to the seller side, but the data technically doesn't say that in this file), but 110 transactions (88%) had a 2.5% fee, and one 2.25% and one a 2% fee.
Key takeaways:
--No one firm and no one agent "owns" Piedmont.
--More than likely, you will take an offer from an agent and brokerage that is not the same as that of the person representing you. And that's good--the definition of an "arm's length transaction."
Call me for more detailed analysis of pricing trends among the market's price bands, and early reviews of impacts of the new tax legislation.
Monday, July 10, 2017
Piedmont Update--2Q17--
As mentioned last quarter, we've seen a flattening of the real estate market in San Francisco, and see that now in the East Bay as well. In the second quarter of 2017, Piedmont saw 48 homes sold, for a typical $2.075 million (median $2.033m; average $2.13m) in an average 14 days on market, for about 15% over the asking price. Sales typically saw three or four offers, though one 3 BR/1 BA home on Harvard offered at $1.15m sold for $1.7m, with 21 offers! As I've said before, prices for very attractive three-bedroom and 1 or 2-bath homes in under about 1700 sf in Piedmont, Berkeley and Oakland are now at about parity--new for our markets.
A year ago, also during the 2nd quarter, 36 homes sold for a typical $2.2 million (med $2.151m; av $2.255m). We saw lots of wobbles in the past year so don't get too hung up on that higher number. Then, the typical home sold in 12 days with three offers, and was 16% over asking.
More recently, last quarter (1Q17), 15 homes sold at a typical $2.15 million (med $1.975m, av $2.319m). Twelve days, 7 offers, 16% over asking.
So quite a bit of noise in there, but generally, continued strength in the market based on things like price, number of offers, length of time on the market, and so on. There are still way more buyers for a well-prepared home than there are sellers.
Looking at neighboring Oakland (94610, 11, 18), the market remains robust and up about 10% compared to a year ago. The typical single-family home in nearby Oakland sold for about $1.35 million this last quarter (compared to$1.35m in 1Q17 and $1.22m in 2Q16). Throughout, homes sold in about two weeks (they might have sold more quickly, but agents typically advise holding offers at bay until potential buyers have had two weeks to find the house, often through word-of-mouth, and visit). Again, we see a flattening of the market in the more recent time period. But no fall-off in buyer demand, and believe me, I've been looking for those signs on behalf of my buyer clients!
Most recently, I was looking at the over $2 million market in Berkeley. There has been some buzz about a quieter market, and there have been fewer very high-end homes sold more recently, but that's perhaps because the backlog of higher-end homes and long-held estates held off market during the downturn has come through the pipeline in the past year. But prices, time on market, price per square foot and sales prices have all held up in the past year, and three months.
Looking more broadly at Berkeley, prices there are up about 6% year-over-year, from a typical $1.2 million in 1Q16 (med $1.165m; av $1.263m) up to $1.275 million this past quarter (med $1.251m; av $1.307m). Homes there sold in an average 14 days, with 5-6 offers, and about 21% over asking this past quarter. The number of homes sold is down just a tad this big selling season compared to last, but price increases in that market are strongest in the region this year compared to last.
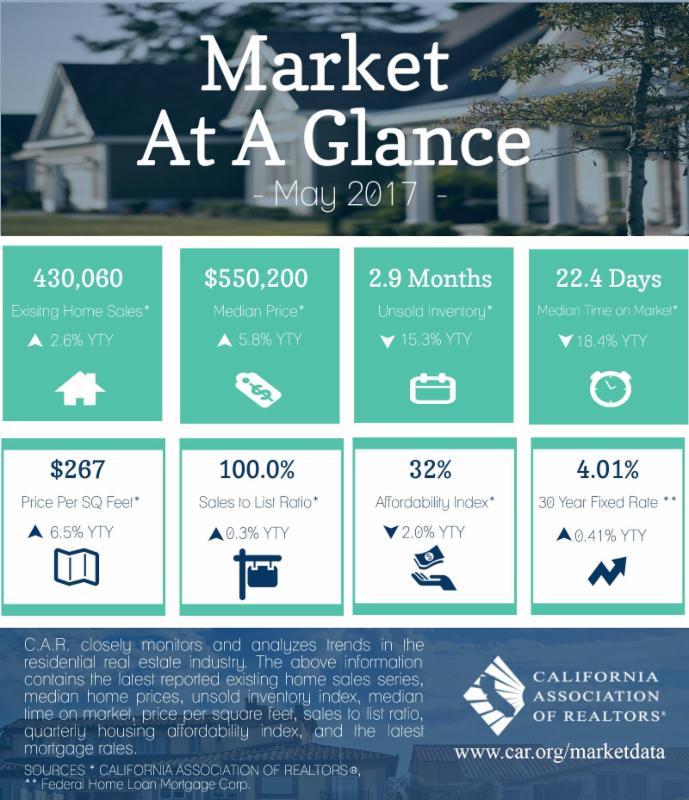
Click here to see a nice graphic from the Ca Assoc of Realtors regarding trends across Alameda County (prices up 4.1% y-o-y), see below for the statewide market at a glance from CAR (prices up 2.6% y-o-y), and click here for CAR's chief economist Leslie Appleton-Young's recent very detailed economic and housing market presentation to the Oakland-Berkeley Assoc of Realtors. A few juicy tidbits:
--the number of sales in the SF Bay Area is down 21% y-o-y (compared to down 13% in SoCal and down 11% in the Central Valley);
--the housing turnover rate (the frequency with which we move) is very low, in historic terms, at once every 10 years. This appears to be because of the boomer generation demographic bubble, low interest rates, the capital gains tax impact at sale, Prop 13/low property taxes, and the lack of inventory to move to;
--we are getting behinder and behinder (that's my attempt to introduce calculus into the discussion) in the ratio of needed new housing units based on demographics, to available or newly constructed housing units. We are missing about 80,000 needed housing units each year right now. (And this overarching shortage of supply leads to both long term upward price pressure and decreased affordability);
--the only areas of the state that have seen price increases back above the level of 2006 are in the immediate Bay Area. All of SoCal, the Central Valley, and the further flung counties in the Bay Area (e.g. Solano, Napa) are still "underwater" relative to their previous highs.
There is lots more there of interest----
Is Now the Time to Re-Fi?
Rates are the lowest so far this year, so if you've been living under a rock these past five years, or have changes in your home equity or job situation that make a re-fi a constructive option, ask me for a referral to my favorite five local lenders. And you know that federal law prohibits kickbacks or referral fees among your real estate professionals (brokers, lenders, and title companies, for instance), right? I managed the promulgation of that reg in my former life, as Deputy Assistant Secretary for Policy at HUD......
Subscribe to:
Posts (Atom)


