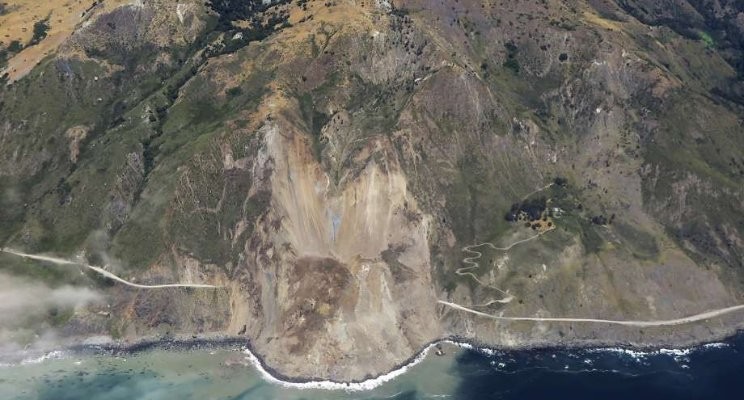
The Inclusion of Seepage Forces in Slope Stability Analyses
The Mud Creek Landslide, pictured above, which recently cut Highway 1 in California, was the result of unusually prolonged and heavy rains in Northern and Central California this last winter. The total precipitation in the Sacramento River catchment, north and east of where this slide occurred on the coast, was 200 percent of the 100 year average. Thus, the slide was almost certainly caused by the rise of water in the mountains behind the slide in the photograph and that a slide occurred in this terrain after such a winter is not a surprise and it did not require detailed analysis to predict that it might happen. But what about designing a long-term repair which might include installing significant drainage of the mountainside? Are there tools available that might guide design engineers on the extent of drainage required in order to maintain a desired factor of safety? You might think that there are - that standard slope stability programs can be used for this purpose - but you would be wrong.
More generally, slope failures are often said to be due to water, or rather the failure to recognize the correct water conditions, and application of the pore pressures normal to the bases of the slices in conventional slope stability analyses may give the impression that this accounts for seepage forces in non-hydrostatic conditions. However, this is not correct. The seepage forces that one assumes might be applied by using total unit weights and specifying the pore pressures along the slip surface do not actually make their way into the analysis. This can easily be checked by running an analysis of a cohesive slope with varying phreatic surfaces. Regardless of how steep the phreatic surface, it will make no difference to the computed factor of safety. The reason that a cohesive slope, or a slope in which all the strengths are specified as fixed quantities, as with undrained shear strengths, must be used in this exercise is that the strength of frictional material will vary with the normal effective stress so that changing the phreatic surface will make a difference, but it does not make a difference to the limit equilibrium problem.
This problem related to seepage forces was noted by King (1989) and is most simply explained by saying that if the seepage forces are pictured as boundary water pressures, the corresponding forces will be applied at the centre of the base of each slice and they make no difference to the standard equations of equilibrium. They make no difference to the moment because the moment arm is zero and they are not included in the solution for force equilibrium parallel to the base of the slice. They make no difference to force equilibrium normal to the base of the slice because the force due to the weight of the slice is fixed and increasing the pore pressure simply reduces the effective stress, which may change the calculated shear strength, but doesn’t impact the solution of the equations of equilibrium. The shear strength will change if a frictional material is specified but it has no effect if the shear strength is specified as a fixed number. The writer and his then colleagues learnt this the hard way some years ago when trying to include excess pore pressures generated by earthquake loading in a second stage analysis. Once the programming was completed we found that it made no difference to the calculated factor of safety! King suggested a solution which involved calculating the distributed seepage forces and applying them at the appropriate height in each slice, but this is a little unwieldy and requires a companion seepage analysis, so that his proposed solution has never caught on.
However, it is easy to specify the seepage forces as horizontally applied forces on each slice in the Ordinary Method of Columns (OMC), as discussed by Pyke (2017a). Pyke (2017b) explains why previous criticisms of the Ordinary Method of Slices (OMS), of which the OMC is a 3D extension, are misplaced and shows that if the alternate method of specifying unit weights mentioned by both Whitman and Bailey (1967) and Duncan, Wright and Brandon (2014) is used, very reliable results are obtained. It turns out that any differences between the OMS and the OMC and methods of analysis that “fully satisfy equilibrium” are due not to how unit weights and pore pressures are treated but the different distributions of normal stresses around the potential slip surface.
The application in the OMC, and non-application in Spencer’s method, of seepage forces is illustrated in Figure 2, which shows an idealized levee section that is based on real levees in the Sacramento - San Joaquin Delta of California. Seepage through these levees is controlled by pumping from a drainage ditch at the landside toe of the levee. All the analyses that are shown were conducted using TSLOPE, which is an inherently 3D program, but can also be used for conventional 2D analyses of any section cut through a 3D model or specified independently. The soil properties are initially specified entirely as a cohesion, so that the shear strengths used in both Spencer’s method and the OMC are the same, despite the difference in the distribution of the normal stresses which can be seen in Figures 2(a) and 2(b). In Figures 2(a) and 2(b) the phreatic surface is made flat and brought down below the levee so that there are no seepage forces. For this case Spencer’s Method and the OMC give identical factors of safety of 1.27, as shown on the figures and in Table 1. [The figures are all called Figure 2 because they are taken from the longer article "Pros and Cons of the Analysis of Slope Stability by Various Methods of Slices or Columns" that is posted on http://rpce.us]

Figure 2(a) – Flat Phreatic Surface, Spencer

Figure 2(b) – Flat Phreatic Surface, OMC
In Figures 2(c), (d), (e) and (f) the phreatic surface is raised in two steps and it can be seen that the factor of safety by Spencer’s Method does not change. Note that for the top phreatic surface there is a red flag on the first slice using Spencer’s method. This is not due to interslice tension but is the result of a negative normal stress on the base of that slice as a result of the steep angle of inclination of the base, the same thing that standard implementations of the OMS has been criticized for. It can be eliminated by moving the tension crack to the left but in this case it makes no difference to the calculated factor of safety. The same issue does not arise in the OMC as implemented in TSLOPE because the alternate method of calculating normal stresses is used, as explained above.

Figure 2(c) – Middle Phreatic Surface, Spencer

Figure 2(d) – Middle Phreatic Surface, OMC

Figure 2(e) – Top Phreatic Surface, Spencer

Figure 2(f) – Top Phreatic Surface, OMC

Table 1 – Factors of Safety, All Cohesion Case
It may be seen that the OMC gives factors of safety which are 15 and 23 percent lower than the factors of safety by Spencer’s method so that provides a measure of the importance of including seepage forces. For this levee example, the difference could be critical, but this example has been chosen to represent something of a worst case and often the seepage forces do not make this much difference because they are small relative to the driving forces due to gravity. But if you can’t or don’t make a check on the magnitude of the seepage forces, you will never know.
If the shear strength is specified to be entirely non-cohesive and is thus a function of the normal stresses at the bases of the columns, the effect of changing the phreatic surface becomes more dramatic because it includes two factors, the seepage forces and a change in the shear strengths. This can be seen in the following figures. Figures 2 (g) and 2(h) show the solution for the flat phreatic surface using both Spencer’s Method and the OMC. It can be seen that the normal forces in Spencer’s method, which implies that the potential sliding mass is rigid, are more spread out, resulting in higher average shear strengths and hence a higher factor of safety than the OMC solution, which implies a more flexible potential sliding mass. The truth likely lies somewhere in between these two limits so the engineer has to decide whether the potential sliding mass is more rigid or less rigid in assigning weights to the two alternate answers.

Figure 2(g) – Flat Phreatic Surface, Spencer, Cohesionless

Figure 2(h) – Flat Phreatic Surface, OMC, Cohesionless
The results for the top phreatic surface are shown in Figures 2(i) and 2(j). It may be seen that the result of combining the lack of seepage forces in Spencer’s Method and the effect of the different normal stress distribution is now quite large. The OMC factor of safety for the flat phreatic surface was 75% of the Spencer factor of safety but another 75% or so reduction due to the different normal stress distribution now means that the OMC factor of safety is only 55% of the Spencer factor of safety. Again, this might be something of an extreme case since both effects are maximized. In practice a levee would not be composed of solely cohesionless materials, nonetheless, even a factor of safety of 1.5 and a conservative choice of soil strength parameters might not provide the expected margin of safety for levees with significant cohesionless soil content if the analysis is done using standard limit equilibrium methods. Figures for the intermediate case are not shown but the calculated factors of safety are shown for all three cases in Table 2.

Figure 2(i) – Top Phreatic Surface, Spencer, Cohesionless

Figure 2(j) – Top Phreatic Surface, OMC, Cohesionless

Table 2 – Factors of Safety, Cohesionless Case
Conclusion
Returning to just the question of seepage forces, these may be critical in some cases, such as the Mud Creek Landslide, but there are other cases where they may not make that much difference, suggesting that an increase in the total weights, elimination of negative pore pressures in partially saturated soils, a change from drained to undrained loading conditions, or more general softening of soils might be bigger factors in why landslides often appear to be triggered by water. But, in critical cases the engineer needs to use a method of analysis such as the OMC, which does include seepage forces, in order to either correctly back-calculated shear strengths from a failure or to optimize a design going forward.
References
Baligh, M.M., and Azzouz, A.S., “End Effects on Cohesive Slopes”, Journal of Geotechnical Engineering, ASCE, Volume 101, No. 11, 1975
Ching, R.K.H., and Fredlund, D.G., “Some difficulties associated with the limit equilibrium method of slices”, Canadian Geotechnical Journal, Vol. 20, pp. 661-672, 1983
Duncan, J.M., Wright, S.G. and Brandon, T.L. “Soil Strength and Slope Stability, 2nd Edition”, ISBN: 978-1-118-65165-0, Wiley, September 2014
Hovland, H.J., “Three-dimensional slope stability analysis method”, Journal of the Geotechnical Engineering Division of ASCE, Vol. 103, No. 9, 1977
Hungr, O., Salgado, F.M. and Byrne, P.M., “Evaluation of a Three-Dimensional Method of Slope Stability Analysis”, Canadian Geotechnical Journal, Vol. 26, pp. 679-686, 1989
King, G.J.W., “Revision of the effective-stress method of slices”, Geotechnique, Vol. 39, No. 3, 1989
Krahn, J., “The 2001 R.M. Hardy lecture: The limits of limit equilibrium analysis”, Canadian Geotechnical Journal, Vol. 40, pp. 643-660. 2003
Mitchell, J.K., Seed, R.B., and Seed, H.B., “Kettleman Hills Waste Landfill Slope Failure I: Liner System Properties”, Journal of Geotechnical Engineering, Volume 116, No.4, pp. 647-668, 1990
Morgenstern, N.R., and Price, V.E., “The Analysis of the Stability of General Slip Surfaces”, Geotechnique, Vol. 15, No. 1, pp.79-93, 1965
Seed, H.B., “Nineteenth Rankine Lecture: Considerations in the Earthquake Resistant Design of Earth and Rockfill Dams”, Geotechnique, Vol.24, No.3, September 1979
Seed, R.B., Mitchell, J.K., and Seed, H.B., “Kettleman Hills Waste Landfill Slope Failure II: Stability Analyses”, Journal of Geotechnical Engineering, Volume 116, No. 4, pp. 669–690, 1990
Spencer, E., “A Method of Analysis of the Stability of Embankments Assuming Parallel Inter-Slice Forces”, Geotechnique, Vol. 17, No. 1, pp. 11-26, 1967
Whitman, R.V. and Bailey W.A., "Use of Computers for Slope Stability Analysis." Proc. ASCE, Vol. 93, No. SM4, July 1967
Wright, S.G., H. Bolton Seed Lecture, http://www.geoinstitute.org/video/2013-seed-lecture-slope-stability-computations-wright/, 2013
PhD (IISc Bangalore), MTech (IIT Kanpur)
1yThank you. Interesting read.
Independent
6yThe Electronic Monitoring Cable Anchor (EMCA) or Closure Monitoring Device (CMD) fitted with an ELI (Electronic Load Indicator) does not rely on the human element as a primary warning solution - instead it becomes the primary real time warning solution by actively monitoring and measuring tension with any movements in the hanging walls, sidewalls and/or pillars it is installed on. The EMCA is set to an upper and lower threshold which informs the Mine Management Team via SMS and email of any change of condition. The device also records a history of specific support tension data in a user database and can indicate the condition in the rock, requiring immediate action. The system also has a user interface which can be configured to log in and view real time or historical data. This system utilises more than one method of communication (Leaky feeder, Fiber Optic or Wireless). The system communicates the real time information to the surface control room and also gives visual indications by means of a tri-color LED mounted on the device. We believe this system is a life saver and will prove itself to be a reliable safety management system, capable providing effective early warning of life threatening situations.
Managing Director at OGI Groundwater Specialists Ltd
6yI agree with Alej above. 2D FEA is now very simple. My experience in the U.K. Is that slip failures are normally progressive, caused by loss of ground at the seepage face. This causes relatively shallow slips. As designers, we focus on the Groundwater to ensure minimal pore water pressure, and this stabilises the slope. http://www.ogi.co.uk/design-of-dewatering-systems/
Chief Resident Engineer - Tenerife's Ring Road / Jefe Unidad A.T - Anillo Insular de Tenerife
6yVery good article!It'd be interesting to look at this slope failure in detail using different softwares and authors to come up with the bests approaches. I have been using several geotechnical softwares (tslope, not yet) but there are well known Finite Element softwares that do consider seepages forces.