Citation:
Abstract:
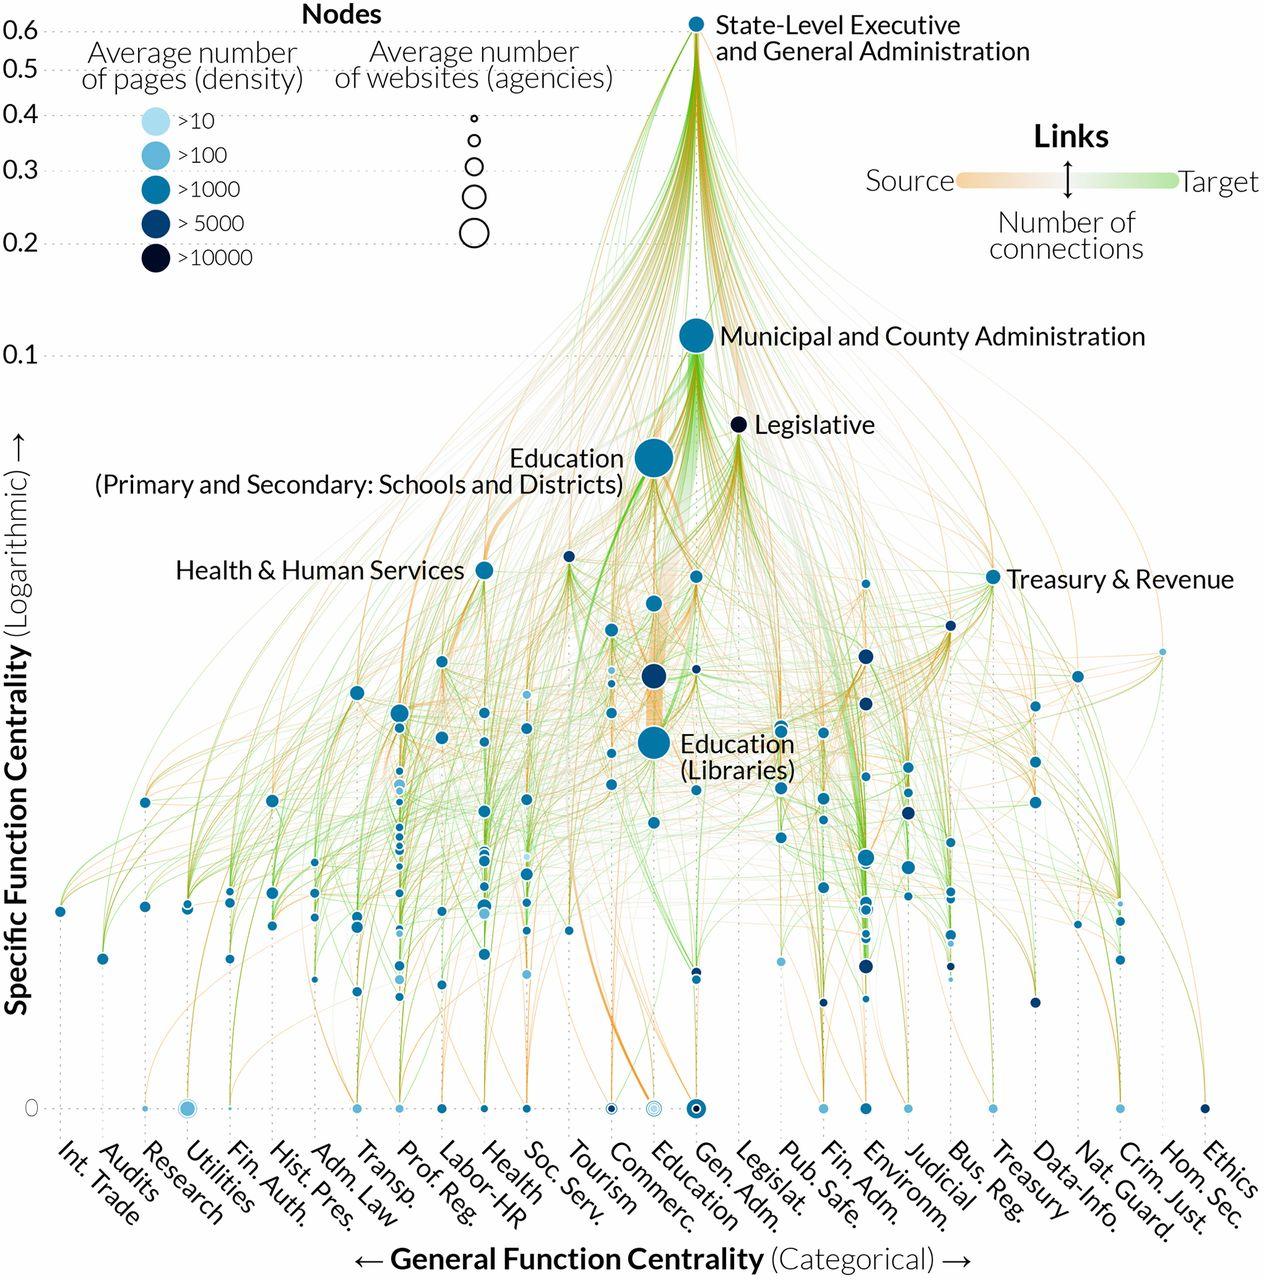
Governments in modern societies undertake an array of complex functions that shape politics and economics, individual and group behavior, and the natural, social, and built environment. How are governments structured to execute these diverse responsibilities? How do those structures vary, and what explains the differences? To examine these longstanding questions, we develop a technique for mapping Internet “footprint” of government with network science methods. We use this approach to describe and analyze the diversity in functional scale and structure among the 50 US state governments reflected in the webpages and links they have created online: 32.5 million webpages and 110 million hyperlinks among 47,631 agencies. We first verify that this extensive online footprint systematically reflects known characteristics: 50 hierarchically organized networks of state agencies that scale with population and are specialized around easily identifiable functions in accordance with legal mandates. We also find that the footprint reflects extensive diversity among these state functional hierarchies. We hypothesize that this variation should reflect, among other factors, state income, economic structure, ideology, and location. We find that government structures are most strongly associated with state economic structures, with location and income playing more limited roles. Voters’ recent ideological preferences about the proper roles and extent of government are not significantly associated with the scale and structure of their state governments as reflected online. We conclude that the online footprint of governments offers a broad and comprehensive window on how they are structured that can help deepen understanding of those structures.
Visualizations and datasets available on project website >>
Full Text